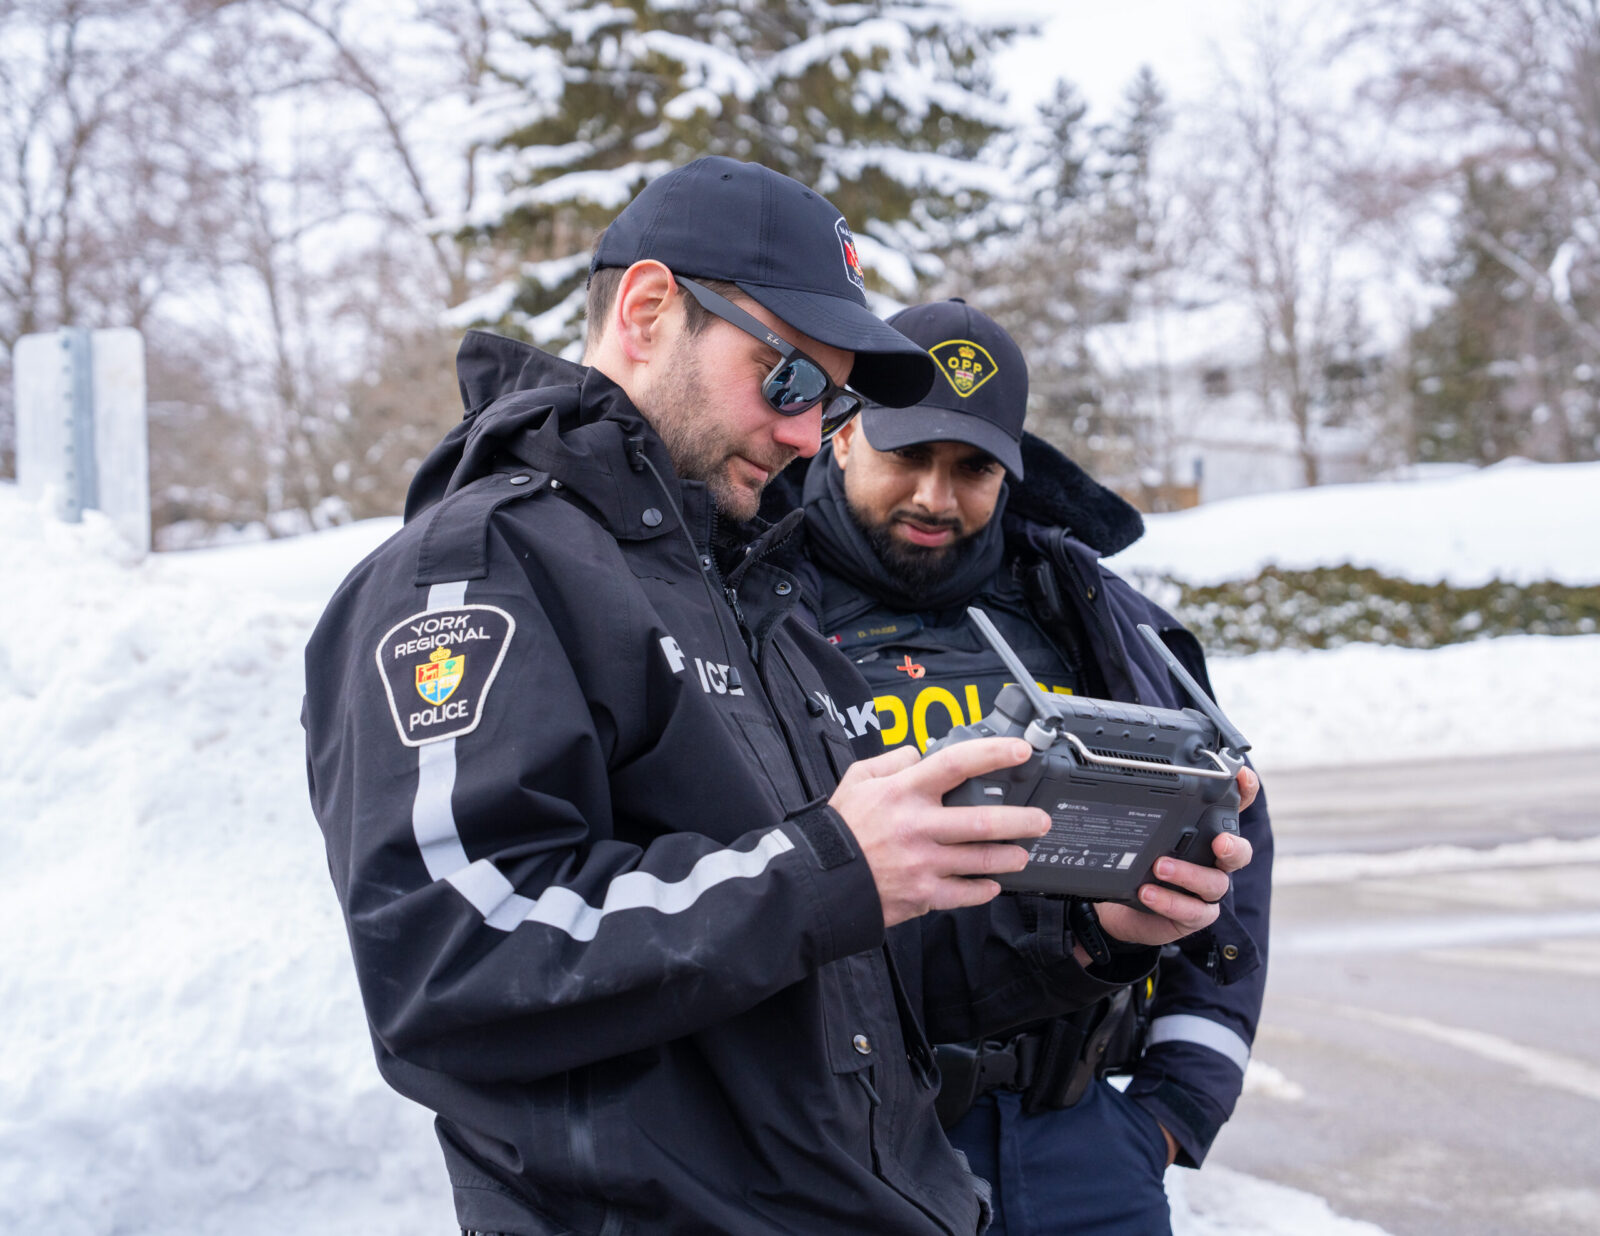
Statistical information

Public Complaints Accepted by the Law Enforcement Complaints Agency (LECA)

Public Complaints Accepted by the Law Enforcement Complaints Agency (LECA)
2023
2024
Formal Discipline
0
1
Informal Discipline
0
1
Informal Resolution
11
11
Unsubstantiated
23
19
Withdrawn
28
19
Policy/Service
20
7
LECA Cannot Proceed
4
7
5 Discrimination – Human Rights Code – CSPA
N/A
2
8 Unlawful Detention – CSPA
N/A
2
11 Unnecessary Force – CSPA
N/A
13
Outstanding Files at Year End
32
27
Total Complaints Accepted and Investigated
118
109

The Law Enforcement Complaints Agency was formerly known as the Office of the Independent Police Review Director

Public Complaints Not Accepted By LECA

Public Complaints Not Accepted By LECA
2023
2024
Over Six Months
0
1
Not in Public Interest, Other Law, etc.
135
30
Not Directly Affected
1
2
Retained by LECA
0
0
Section 156&158(1)(d) CSPA – Not in public interest, Frivolous, etc.
N/A
72
Section 158(2) – Six Month Period
N/A
1
Total Complaints NOT ACCEPTED by the OIPRD
136
106
Total Complaints
254
215

Classification of Complaints

Based on 1736 Officers employed at YRP, public complaints total 0.12 per officer

Indicator

Indicator
2023
2024
Variance (%)
Population
1,258,161
1,279,529
1.7

Benchmarks: Five-year Statistical Comparison

What this chart means to you: Gross Cost per Capita represents expenditures divided by the population of the area served by York Regional Police, rounded to the nearest dollar. Member-to-Population counts represent the population divided by the number of police officers and civilian staff. Police-to-Population counts represent the population divided by the number of police officers.

Police-to-Population counts represent the population divided by the number of police officers. 
Member-to-Population counts represent the population divided by the number of police officers and civilian staff.

Calls for Service

Calls for Service
2023
2024
Variance (%)
Calls for Service (Citizen Generated)
303,256
261,174
-13.9
Number of Calls Dispatched
117,154
113,700
-2.9
9-1-1 Calls Received
328,855
330,959
0.6
False Alarms Received
2,634
2,786
5.8

Victim Services

Victim Services
2023
2024
Variance (%)
On-Scene Occurrences
531
533
0
Telephone Crisis Calls/Office Visits
16,594
17,739
7
Total Clients Served
15,577
19,701
26
Female
9,017
10,148
13
Male
2,671
3,649
37
Transgender
14
19
36
Non-binary
6
2
-67
Children
3,869
5,883
52

Youth Crime

Youth Crime
2023
2024
Variance (%)
Youth Charged
732
724
-1
Processed by Other Means
1,082
993
-8
Total
1,814
1,717
-5

Hate Crime

Hate Crime
2023
2024
Variance (%)
Incidents (Criminal)
293
277
-5

Cost of Policing

Cost of Policing
Actual
Budget
Variance
Salaries and Benefits
$389,728,397
$383,484,096
$6,244,300
Program Specific Expenses
$4,635,780
$4,501,500
$134,280
Professional Contracted Services
$2,841,718
$2,707,100
$134,618
General Expenses
$24,851,855
$23,542,175
$1,309,680
Financial Charges
$302,477
$338,580
$36,103
Insurance
$2,946,287
$2,946,287
$0
Occupancy Costs
$11,192,663
$11,206,826
$14,163
Minor Capital
$775,513
$481,900
$293,613
Debt Related Payments
$7,571,277
$7,555,182
$16,095
Internal Charges
$78,556
$0
$78,556
Contribution to Reserves
$12,124,645
$11,884,018
$240,62
Total Expenditures
$458,520,927
$450,420,812
$8,100,115
Total Revenues
$47,494,309
$40,363,812
$7,130,497
Net Position
$411,026,619
$410,057,001
$969,618

Provincial Offence Notices Comparison

Provincial Offence Notices Comparison
2022
2023
2024
Offences
58,761
52,908
64,298

Uniform Strength

Uniform Strength
2024
Authorized
1,765
Actual
1,791.5

Civilian Strength

Civilian Strength
2024
Authorized
726
Actual
715

Crime Rates

Crime Rates
2023
Actual

Rate
2024
Actual

Rate
Variance
Actual

Rate
Crimes Against Persons
14,410
1,145.32
13,882
1,084.9
-3.7
-5.3
Crimes Against Property
32,472
2,580.91
30,886
2,413.9
-4.9
-6.5
Other Criminal Code
6,019
478.39
6,734
526.3
11.9
10
Weapons Violations
761
60.49
650
50.8
-14.6
-16
Drug Violations
886
70.42
977
76.4
10.3
8.5
Other Federal Violations
43
3.42
50
3.9
16.3
14
Total Criminal Code Violations (Excluding Traffic)
54,591
4,338.95
53,179
4,156.1
-2.6
-4.2
Criminal Code Traffic Violations
5,524
439.05
5,501
429.9
-0.4
-2.1

Clearance rates

Clearance rates
2023
2024
Variance
Crimes Against Persons
50.2
49.5
-0.7
Crimes Against Property
22.7
27.9
5.2
Other Criminal Code
78.9
88.1
9.2
Weapons Violations
69.9
75.2
5.3
Drug Violations
96.5
90.4
-6.1
Other Federal Violations
81.4
30
-51.4
Total Criminal Code Violations (Excluding Traffic)
38
42.9
4.9
Criminal Code Traffic Violations
43.8
38.8
-5